To search this page for a specific model or tool please use the keyboard "Control+F" find feature and type the term you are seeking.
The Center for Reliability Growth (CRG) works towards improving reliability by providing policy, guidance, standards, methods, tools, and training. In doing so, reliability, materiel/operational availability, and initial operational testing success rates can be increased while support costs and logistics footprint are decreased.
The CRG maintains a collection of key reliability tools, models, and documents. By capturing and archiving actual test metrics/data, the models and tools are validated and improved. The CRG also applies resources to perform reliability or physics-of-failure analyses for select high-impact projects. Additionally, the CRG develops contract language, methodology, policy, and military handbooks & standards. The CRG allows for return on investment, reduced test time, and reduced O&S cost through the use of design-for-reliability activities.
For reliability growth related questions, please e-mail usarmy.apg.devcom-dac.list.reltools@army.mil.
Reliability Models & Tools
The DEVCOM Analysis Center provides various Reliability Growth tools written in Microsoft Excel. One of these tools is The Reliability Scorecard which provides a structured engineering and analytical approach to track the achievement of reliability requirements and the adequacy of the overall Reliability Program throughout the program's acquisition life cycle. The DEVCOM Analysis Center has also developed several models designed for planning, tracking, and projecting reliability. For more information on the tools offered, see the descriptions below.
Request tools by emailing usarmy.apg.devcom-dac.list.reltools@army.mil.
Please Note: Distribution of DEVCOM Analysis Center software is restricted to U.S. Government organizations and their contractors. DoD Contractors must complete the contractor portion of the request form in order to receive any software. Submitting this form does not guarantee that you will receive the software tools — DEVCOM Analysis Center reserves the right to deny requests. All requests will be reviewed in compliance with DEVCOM Analysis Center security measures.
DEVCOM Analysis Center Models
Planning Models
- Planning Model based on Projection Methodology (PM2) Continuous
- Planning Model based on Projection Methodology (PM2) Discrete
Tracking Models
- Reliability Growth Tracking model (RGTM) Continuous
Projection Models
- AMSAA-CROW Projection Model (ACPM)
- AMSAA Discrete Projection Model (ADPM)
- AMSAA Maturity Projection Model (AMPM)
Scorecards
- Reliability Scorecard
- Software Reliability Scorecard
Test Planning Tools
- IOT Planning Tool (IPT) Continuous
- IOT Planning Tool (IPT) Discrete

Planning Model based on Projection Methodology (PM2) Continuous
Purpose
The purpose of PM2 Continuous is to develop a system-level reliability growth planning curve that incorporates the developmental test schedule and corrective action strategy. The planning curve and associated steps serve as a baseline which reliability assessments may be compared against, possibly highlighting the need for reallocation of resources. Unlike the AMSAA Crow Planning Model, the PM2 Continuous model does not have a growth rate parameter, nor is there a comparable quantity. Furthermore, PM2 Continuous utilizes planning parameters that are directly influenced by program management, which include:
- MI , the planned initial system MTBF;
- MS, the Management Strategy, which is the fraction of the initial failure rate addressable via corrective action;
- MG, the MTBF goal for the system to achieve at the conclusion of the reliability growth test;
- μd, the planned average FEF of corrective actions;
- T, the duration of developmental testing; and
- the average lag time associated with corrective actions.
Benefits
The benefits associated with PM2 Continuous include:
- can determine the impact of changes to the planned test schedule and associated CAPs;
- measures of programmatic risk are not sensitive to the length of the initial test phase (which is a limitation of the AMSAA Crow Planning Model);
- can use different average corrective action lag time for each test phase;
- provides an MTBF target to track against;
- can be applied to programs with limited opportunities for implementation of corrective actions; and
- utilizes planning parameters that are directly influenced by program management.
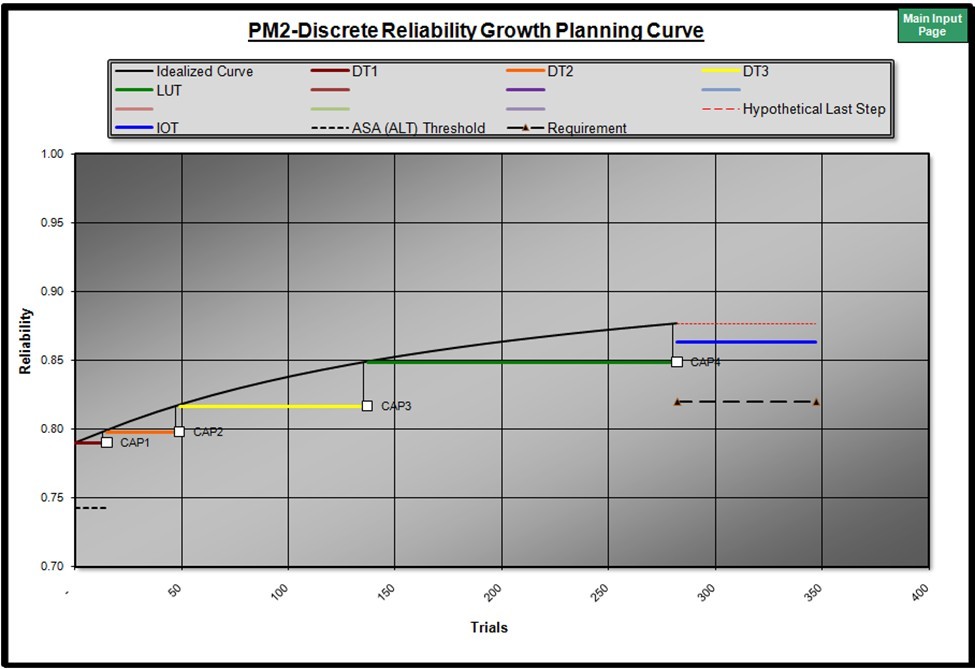
Planning Model based on Projection Methodology (PM2) Discrete
Purpose
Based on research conducted by J. B. Hall in his PhD Dissertation and documented in ATEC TN, "Reliability Growth Planning for Discrete Systems," PM2-Discrete was developed. PM2-Discrete is the first methodology specifically developed for discrete systems and is also the first quantitative method available for formulating detailed plans in the discrete usage domain. The model has the same conditions of use as the continuous PM2 model, except for the usage domain. PM2-Discrete utilizes planning parameters that are directly influenced by program management, which include:
- RI, the planned initial system reliability;
- MS, the Management Strategy, which in the discrete case is a value between 0 and 1 that decomposes RI into the factors RA and RB;
- RG, the goal reliability for the system to achieve at the conclusion of the reliability growth test;
- μd, the planned average FEF of corrective actions;
- T, the duration of developmental testing; and
- average delay associated with corrective actions.
Benefits
The benefits associated with PM2-Discrete include:
- PM2-Discrete can determine the impact of changes to the planned test schedule and associated CAPs.
- PM2-Discrete can use different average corrective action delay periods for each test phase.
- PM2-Discrete provides a reliability target to track against.
- PM2-Discrete can be applied to programs with limited opportunities for implementation of corrective actions.
- PM2-Discrete offers several reliability growth management metrics of basic interest including:
- Expected number of failure modes observed through trial t;
- Expected reliability on trial t under instantaneous failure mode mitigation;
- Expected reliability growth potential;
- Expected probability of failure on trial t due to a new B-mode; and
- Expected probability of failure on trial t due to a repeat B-mode expressed as a fraction of the initial B-mode probability of failure in the absence of failure mode mitigation.
The Reliability Growth Tracking Model — Continuous (RGTMC)

Purpose
The purpose of the RGTMC is to assess the reliability improvement (within a single test phase) of a system during development, for which usage is measured on a continuous scale. The model may be utilized if individual failure times are known, or if failure times are only known to an interval (grouped data).
Benefits
The benefits associated with the RGTMC include:
- the model can gauge demonstrated reliability versus planned reliability;
- the model can provide statistical point estimates and confidence intervals for MTBF and growth rate; and
- the model allows for statistical goodness-of-fit testing.
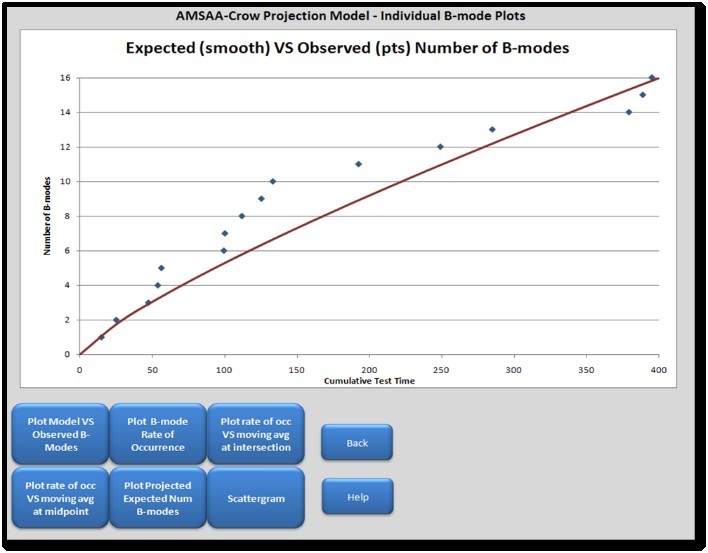
AMSAA-CROW Projection Model (ACPM)
Purpose
The purpose of ACPM is to estimate the system reliability at the beginning of a follow-on test phase by taking into consideration the reliability improvement from delayed fixes.
Benefits
The benefits associated with ACPM include:
- The ability to project the impact of delayed corrective actions on system reliability; and
- The projection takes into account the contribution to the system failure intensity due to unobserved B-modes.
AMSAA Discrete Projection Model (ADPM)

Purpose
The purpose of the ADPM is to provide an estimate of the projected reliability following the implementation of both delayed and non-delayed fixes for discrete (one-shot) systems. The model also provides estimates of the following important reliability growth metrics:
- The reliability growth potential;
- Probability of a new failure mode occurring; and
- Fraction surfaced of the system's initial probability of failure.
Benefits
The benefits associated with ADPM include:
- Corrective actions can be implemented during the test or can be delayed until the end of test;
- Reliability can be projected for future milestones;
- The system's growth potential can be compared to program objectives; and
- The projection takes into account the contribution of the system's probability of failure due to unobserved modes.
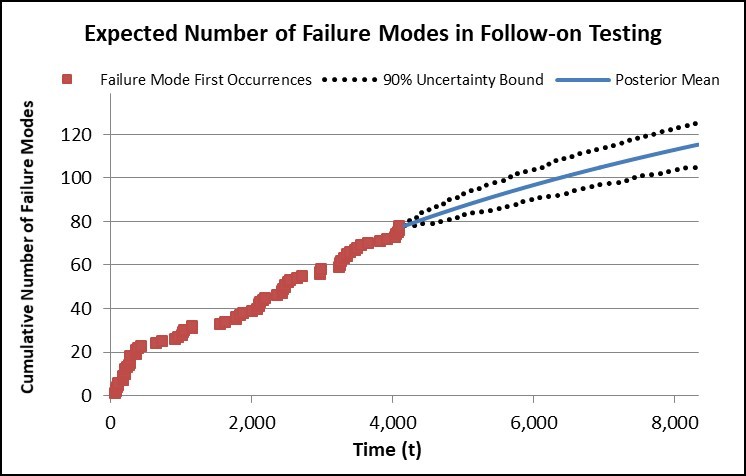
AMSAA Maturity Projection Model (AMPM)
Purpose
The purpose of AMPM is to provide an estimate of the projected reliability following the implementation of both delayed and non-delayed fixes. The model also provides estimates of the following important reliability growth metrics:
- B-mode initial failure intensity
- expected number of B-modes surfaced
- percent surfaced of the B-mode initial failure intensity surfaced
- rate of occurrence of new B-modes
Benefits
The benefits associated with AMPM include:
- Corrective actions can be implemented during test or can be delayed until the end of test;
- Reliability can be projected for future milestones;
- The model can project the impact of delayed corrective actions on system reliability;
- The projection takes into account the contribution to the system failure rate due to unobserved B-modes;
- In situations where there is an apparent steepness of cumulative number of B-modes versus cumulative test time over an early portion of testing after which this rate of occurrence slows, there is methodology to partition the early modes from the remaining modes. These early B-modes must be aggressively and effectively corrected.
- Additionally methodology exists to handle cases where there is an early "gap" or if there appears to be a difference in the average FEFs in early or start-up testing versus the remainder of testing (an apparent or visual difference in failure rate in the initial testing).
Reliability Scorecard


The Reliability Scorecard examines a supplier's use of reliability best practices, as well as the supplier's planned and completed reliability tasks. The Scorecard is important for tracking the achievement of reliability requirements and rating the adequacy of the overall Reliability Program. An early Scorecard assessment may be based solely on a Reliability Program Plan, but as time progresses, the Scorecard assessment will become more accurate if information from technical interchange meetings, a Reliability Case, and results from early reliability tests, are included. The Reliability Case documents the supplier's understanding of the reliability requirements, the plan to achieve the requirements, and a regularly-updated analysis of progress towards meeting the requirements.
The Reliability Scorecard uses eight critical areas to evaluate a given program's reliability progress:
- Reliability requirements and planning
- Training and development
- Reliability analysis
- Reliability testing
- Supply chain management
- Failure tracking and reporting
- Verification and validation
- Reliability improvements
There are 40 separate elements among the eight categories in the Reliability Scorecard. Each element within a category can be given a risk rating of high, medium, or low (red, yellow, or green) or not evaluated (gray). The Scorecard weights the elements, normalizes the scores to a 100-point scale, and calculates an overall program risk score and eight category risk scores.
Benefits include:
- Poor performers can be identified early
- Engineering and reliability program reviews are made consistent
- An improved mechanism to capture useful metrics is provided
Software Reliability Scorecard

The Software Reliability Scorecard extends and complements the general reliability scorecard by examining an individual software development effort and assessing the level of risk associated with the software reliability practices being applied. It also complements existing software approaches, such a CMMI, by examining reliability-specific practices within an individual software project.
The Software Scorecard provides a structured and transparent approach to software reliability and maintains a consistent design with the general reliability scorecard. A total of 57 specific elements are examined across seven key areas of software development and sustainment:
- Program Management
- Requirements Management
- Design Capabilities
- System Design
- Design for Reliability (DfR)
- Test and Acceptance
- Fielding and Sustainment
The scorecard provides a structured and transparent instrument for assessing the health of a software development effort in regards to software reliability and is useful in isolating areas for further analysis and work. The discussion and reflection that occurs as the instrument is applied enables multiple disciplines to see the value of good reliability issues and practices in a structured way. The scorecard is invaluable to uncovering areas of weakness so that technical resources can be best prioritized and, subsequently, more reliable software can be developed.
IOT Planning Tool (IPT) Continuous
Purpose
The purpose of the IPT-C is to help the user choose an appropriate IOT profile and obtain the necessary metrics for developing a reliability program plan. The IPT-C contains two tools called the IOT Planner - Continuous and the OC Curve Plotter - Continuous. These tools can:
- Aid in conducting tradeoff analyses involving the reliability demonstration test parameters, the requirement parameters, and the associated risk parameters for planning reliability demonstration tests;
- Display possible IOT test durations based on the required inputs and the associated risks; and
- Calculate the goal MTBF needed in IOT (MR+) using OC curve methodology.
Benefits
The benefits associated with IPT-C include:
- IOT Planner - Continuous tool can help the user choose an appropriate IOT test duration that satisfies the MTBF requirement and Consumer/Producer risks;
- OC Curve Plotter - Continuous tool can verify that the user's inputted IOT profile is valid;
- Both tools provide the user with important metrics associated with the IOT profiles (e.g., the goal MTBF needed in IOT); and
- Both tools provide the user with the necessary metrics to develop a reliability growth plan (specifically MR+).
IOT Planning Tool (IPT) Discrete
Purpose
The purpose of the IPT-D is to help the user choose an appropriate IOT profile and obtain the necessary metrics for developing a reliability program plan. The IPT-D contains two tools called the IOT Planner - Discrete and the OC Curve Plotter - Discrete. These tools can:
- Aid in conducting tradeoff analyses involving the reliability demonstration test parameters, the requirement parameters, and the associated risk parameters for planning reliability demonstration tests;
- Display possible IOT test durations based on the required inputs and the associated risks; and
- Calculate the goal reliability needed in IOT (RR+) using OC curve methodology.
Benefits
The benefits associated with IPT-D include:
- IOT Planner - Discrete tool can help the user choose an appropriate IOT test duration that satisfies the reliability requirement and Consumer/Producer risks;
- OC Curve Plotter - Discrete tool can verify that the user's inputted IOT profile is valid;
- Both tools provide the user with important metrics associated with the IOT profiles (e.g., the goal reliability needed in IOT); and
- Both tools provide the user with the necessary metrics to develop a reliability growth plan (specifically RR+).
Social Sharing