
Within the sustainment community, the term "staff estimate" is both ubiquitous and meaningless. No two units share the same format, and few deliberately set and target meaningful metrics. While Army Doctrine Reference Publication 6-0, Mission Command, charges staff officers at all echelons to communicate at the knowledge and understanding level of the cognitive hierarchy, it is exceedingly rare to find a staff estimate that provides a maneuver commander with an intuitive picture of his safety stocks for critical classes of supply.
This article builds on information presented in my previous Army Sustainment article, "Assessment-based sustainment reporting: The future of color-coded metrics for supply," by demonstrating how assessment-based metrics and a new format for the universal staff estimate can maximize a commander's battlefield understanding.
SO WHY IS A SUPPLY CHAIN HARDER TO VISUALIZE THAN A MANEUVER PLAN?
When commanders cannot identify the cause of entirely predictable emergencies, after action reviews often delve into measures of effectiveness and performance. Units struggle to determine whether their reports or their metrics are to blame for their gaps in understanding. While commonplace, this is a misdiagnosis of the problem.
Tactical and strategic logistics operate on opposing models. Tactical logistics is focused on effectiveness, while strategic logistics is focused on efficiency. Excesses and duplicative deliveries are the cost for being certain that a maneuver unit can continue fighting the enemy. In contrast, strategic sustainment partners are focused on efficiency because they have a macro-level view of sustainment and often their organizations operate on working capital--customers pay for the services rendered.
At the operational level, the issue is neither efficiency nor effectiveness per se but a failure to create an intuitive visualization of regional and theater safety stocks juxtaposed against distribution capabilities. This misdiagnosis results in a "more is better" approach to materiel management. The upshot is that staffs often present commanders with two mutually exclusive options: either reduce customer wait time by moving support areas forward or increase customer fill rates by getting greater breadth and depth of available stocks at a smaller number of larger, rear-area facilities. The former lowers fill rates, the latter increases distribution time.
INDENTIFYING SAFTEY STOCKS
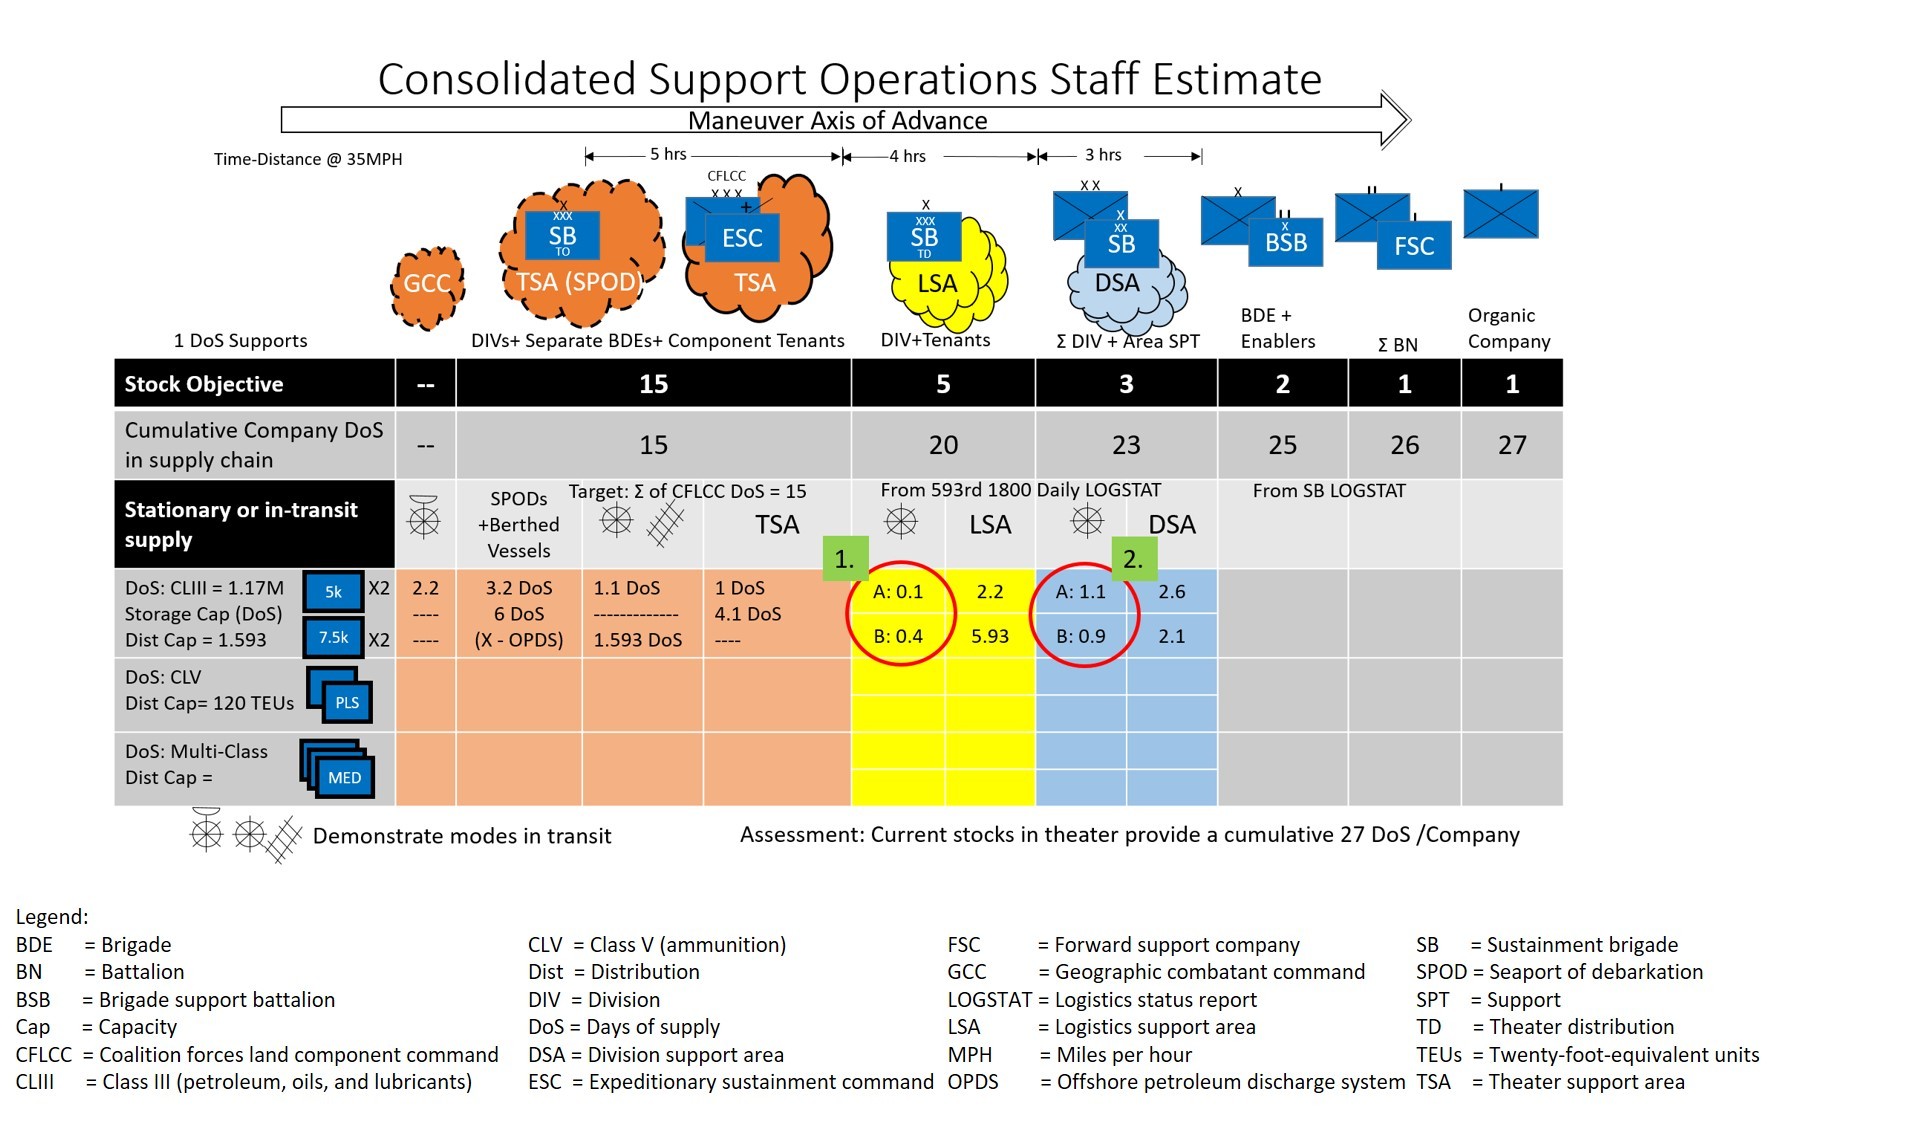
During Warfighter Exercise (WFX) 17-04, the 593rd Expeditionary Sustainment Command (ESC) used the model in figure 1 to visualize safety stocks at and between echelons during distribution. The model intuitively reads in the same cardinal direction as the maneuver fight (left to right for west to east maneuver or right to left for east to west maneuver) and creates a simple sketch of operational and tactical supply points.
Staffs often intuitively discuss commodities in days of supply (DOS) without adding the most crucial descriptor: the echelon of reference. The model used by the 593rd ESC gives commanders a way to visualize their supply chains because it provides a way to finally distinguish between the stocks at each echelon.
Figure 1 graphically represents the staff estimate. An arrow is added to assist the user in determining the direction of action. In the example, the maneuver axis of advance moves from west to east, or left to right, across the slide. Using cardinal directions alleviates communication challenges between armies whose national languages read from right to left. Time and distance between echelons are shown just below the axis of advance line and could be represented with two arrows--one for the main supply route and one for the alternate supply route--with different colored texts to distinguish between the two.
The echelons are color-coded. The theater-level stocks are shown in rust brown and include anything on inbound vessels, on berthed vessels, or in storage tanks at a port. The theater distribution sustainment brigade, shown in yellow, owns stocks between the corps and division levels. Division stocks are shown in blue. Each class of supply is shown horizontally, and each cell highlights three data points. On-hand quantities are shown first. The storage capacity at each node is shown in the middle, and the distribution capacity of the node is shown at the bottom.
A supply node has no distribution capacity of its own, except in rare circumstances. The most common exception is a vessel employing an offshore petroleum discharge system. In that case, the tanker (a supply node) also provides transportation (through a pipeline to a fixed bag or tank on shore). Composite and reinforced companies that own storage and transportation capacities would be shown in the same way. During WFX 17-04, the task organization of those companies supported only local customers and base operations, so they were shown as having no unit distribution capacity.
The arrangement of the staff estimate enables a commander to compare what is on hand to what a single cell can store and transport. Centralizing this information on the staff estimate makes assessment-based metrics easier to script. Color-coded assessment-based metrics make this staff estimate inordinately more powerful; most of the other data that a section normally produces can remain in reference when the commander requires something specific.
This simple chart highlights shortfalls in distribution as well. At its core, if a distribution network is not able to keep an average of one day of supply in transit, then the supported unit will show a decaying trend in their on-hand stocks until the distribution plan changes. Showing that shortfall concisely leads staffs to recommendations for action, whether they are changes in distribution dimension, method, task organization, or contracted options.
The estimate includes an echeloned daily running estimate for bulk fuel in decisive action. Green box 1 highlights an example of where data-based metrics do not accurately report the current situation to a commander and, therefore, do not drive an informed decision. Under current data-focused metrics, this report would require a black status because logistics support area (LSA) A is holding less than 50 percent of the stock objective set for all LSAs (2.2 divisional DOS when five is the stock objective) and is receiving less than it consumes each day.
With assessment-based metrics, the commander would understand that the current distribution plan would create a tactical pause at that LSA. Using raw percentages, the current coloring system does not provide enough context for an assessment. The commander is left with the leading question of when LSA A will reach a green status again.
Green box 2 of the same chart shows how assessment-based metrics identify that the distribution system deliberately bypassed LSA A in order to provide throughput to a division support area closer to the forward line of troops. Throughput always appears as distributing greater than one day of supply to any echelon at the cost of delivering less than one day of supply at its preceding echelon. This throughput is deliberate and conforms to the tactical situation. As a result, the commander is aware of two things. First, nothing is out of balance. Second, his distribution network is setting the correct stance for the maneuver commander to continue the mission.
The linear arrangement of data distinguishes differences in distribution between division A and division B. In the model, the commander can immediately recognize that he needs to make a decision to prevent a tactical pause or halt. His decision may be to alter his distribution method from unit to supply point distribution, to alter his task organization, or to pursue contracts that alleviate a deficit.
In contrast, green box 3 in figure 2 demonstrates that division A not only receives more than it consumes each day but also more than it can store. Over time, the division will use fuel trucks for storage (not distribution) and full fuel trucks will return to their point of origin unused. Commanders can immediately identify that this supply chain is out of balance. A tactical halt is predictable on an easily extrapolated schedule.
Linear visualizations that intuitively match the battlefield are critical to helping sustainment and maneuver commanders understand, describe, and direct their formations. Perhaps just as important is ensuring staff estimates inform decisions. Highlighting the supply chain status across the battlefield does not reach the level of the cognitive hierarchy required to build trust between maneuver and sustainment units.
Supply chain status, combined with the correct metrics, context, analysis, and judgment allow senior leaders to make more accurate and timely decisions to seize and maintain the initiative in decisive action. Used together, the staff estimate and appropriate assessment-based metrics can amplify the value of assessments that commanders provide throughout the chain of command, which shares understanding across multiple echelons simultaneously.
--------------------
Maj. Daniel J.N. Belzer is the executive officer of the 308th Brigade Support Battalion, 17th Fires Brigade. He was previously the lead support operations planner for WFX 17-04 at Joint Base Lewis-McChord, Washington. He holds a bachelor's degree in mechanical engineering from the Virginia Military Institute and a master's degree in supply chain management from Virginia Commonwealth University. He is a graduate of the Red Team, National Security Policy, and Theater Logistics courses.
Brig. Gen. Jack Haley, Col. Dennis Kerwood, retired Col. Dave Saffold, Capt. Jon-Michael King, and many other members of the 593rd ESC contributed to this article.
--------------------
This article is an Army Sustainment product.
Social Sharing