HISPANIC AMERICANS IN THE U.S. ARMY
Introduction
During National Hispanic Heritage Month, we pause and reflect on our shared history as Americans and celebrate the rich mosaic of people and cultures who build and strengthen our Army and our nation. This year’s national theme — “Latinos: Driving Prosperity, Power and Progress in America” — captures that spirit as we observe the unique and storied history Hispanic Americans have in the Army — serving and fighting in almost every war since our nation’s birth.
Today, more than 17 percent of America’s Soldiers and 7 percent of Army civilians are of Hispanic or Latino descent. Like many commemorations, this is a month-long observance, but it’s unique because it begins in the middle of one month — September 15 — and ends in the middle of another, on October 15. The reason for the mid-month celebration is because September 15 is the day Costa Rica, El Salvador, Guatemala, Honduras and Nicaragua celebrate their Independence Day. Mexico celebrates its independence shortly afterwards on September 16, and Chile on September 18. October 12 is significant, too, celebrated across Spain and Latin America as the Day of Hispanic Heritage.
The U.S. Army values the significant contributions of Hispanic Americans. From the Spanish-American War to the War on Terror and beyond, they have not hesitated to defend and show their allegiance to this nation in many ways, but especially through military service. The Army and the U.S. draw strength from the diversity that makes up America's melting pot.
The Rough Riders
Several thousand Hispanic Army volunteers, mostly from the Southwest, fought with distinction in Cuba during the Spanish-American War in 1898.
Among them was Capt. Maximiliano Luna, the only Mexican American officer in the 1st U.S. Volunteer Cavalry — better known as the Rough Riders — led by Col. Theodore Roosevelt.
Pvt. Marcelino Serna — Conspicuous gallantry, unwavering commitment
During World War I, Pvt. Marcelino Serna was recognized for his heroic actions that resulted in the capture of multiple German soldiers, but which also left him injured.
During his recovery, Gen. John J. Pershing, commander-in-chief of the American Expeditionary Forces, personally pinned the Distinguished Service Cross on his chest, the second highest military decoration of the United States Army.
Featured Historical Image - Cuidado - Take Care, Bushmasters!
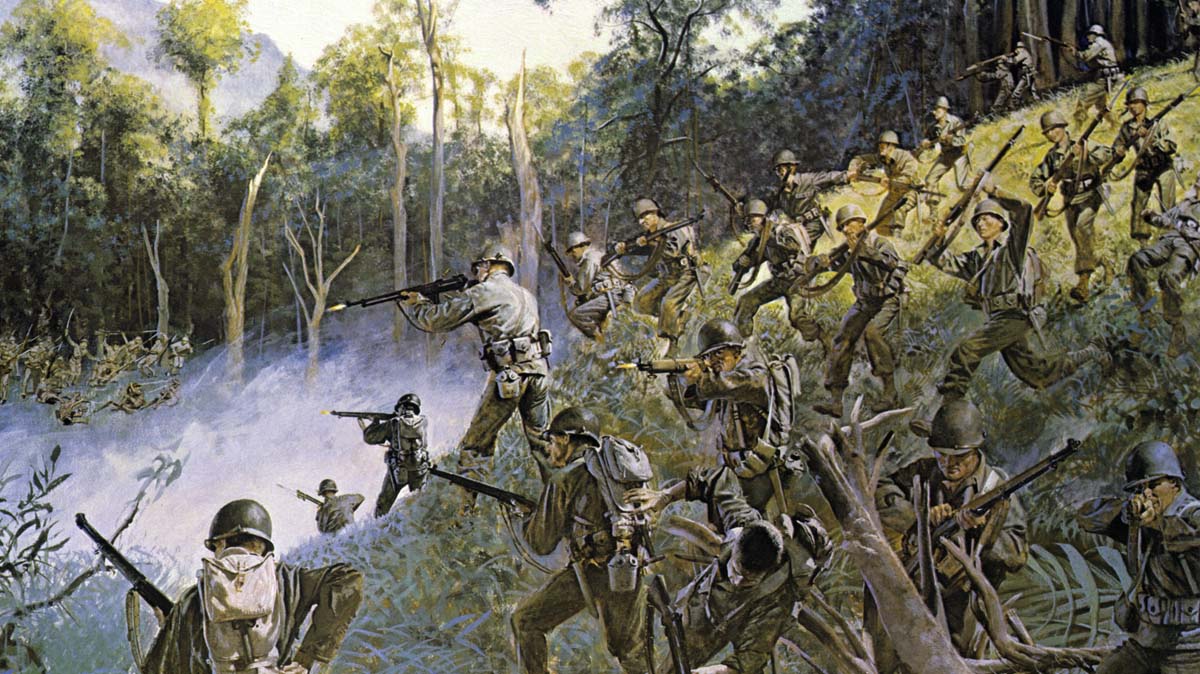
The painting, "Cuidado — Take Care, Bushmasters!," depicts the 158th Infantry Regiment during the Bicol Campaign, Luzon, Philippine Islands, April 3-4, 1945. Photo courtesy of U.S. Army Center of Military History.
The Bushmasters
Originally organized as the Arizona Volunteer Infantry for the Indian campaigns in 1865, the 158th Infantry Regiment mustered in the great Southwest desert. The unit was mainly Mexican-American and North American Indians from 20 tribes.
In 1942 the regiment were deployed to Panama where they trained in jungle warfare. Becoming famous for newly acquired skills, the regiment took the name of the Bushmasters, after the venomous snake which lived in the region. This symbol became the distinguishing shoulder patch of the 158th Regimental Combat Team.
Gen. Douglas MacArthur said of the Bushmasters "no greater fighting combat team has ever deployed for battle."
Related Videos
Gen. Richard E. Cavazos — First Hispanic four-star general
Gen. Richard Edward Cavazos was the first Hispanic four-star general in the United States Army.
Throughout his 33 years of distinguished service in the Army, Cavazos demonstrated exceptional leadership and bravery. In 2023 Fort Hood, the third-largest U.S. military base, was renamed Fort Cavazos in honor of his distinguished service.

Medal of Honor Recipients
The Medal of Honor is the nation's highest medal for valor in combat that can be awarded to members of the armed forces. The medal was first authorized in 1861. Since then, more than 3,400 Medals of Honor have been awarded to members of all DOD services and the Coast Guard, as well as to a few civilians who distinguished themselves with valor. Of these recipients, 44 are Hispanic American Soldiers.
It is estimated that more than 160,000 Soldiers who identify as Hispanic Americans serve in the total Army, comprising nearly 17% of the total force.
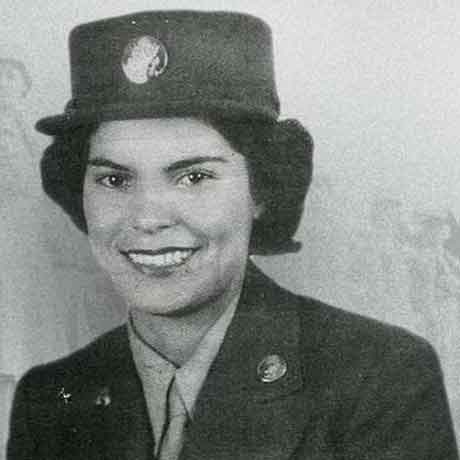
Carmen Contreras-Bozak - First Hispanic American to serve in the Women's Army Corps
Carmen Contreras-Bozak was among the first Puerto Rican women to join the Women’s Army Corps, where she served as interpreter. She spoke five languages: English, Spanish, Portuguese, Italian and French. In January 1943, she was one of 195 women who made up the first cadre of females sent overseas. She arrived in North Africa and was assigned not as a typist or stenographer, like many at the time, but to the Signal Corps — sending and receiving coded messages between General Dwight D. Eisenhower’s headquarters in Algiers and the battlefield in Tunisia.

The 65th Infantry Regiment
A historically all-Hispanic regiment, the 65th Infantry Regiment served in several major conflicts, including World War I, World War II, the Korean War and the Vietnam War. By the Korean War, the unit adopted the nickname "The Borinqueneers." The name originates from Borinquen — the Taino name for the island of Puerto Rico. During its service in Korea, the regiment received four Distinguished Service Crosses and 125 Silver Stars. It also received the American Presidential Unit Citation, the Army Meritorious Unit Commendation, two Korean Presidential Unit Citations and the Greek Gold Medal for Bravery. The regiment was finally integrated in March 1953 and remained in Korea until November the following year.
Related Video — Hispanic-American Soldiers' Contributions to the U.S. Army
Senior enlisted advisor, Command Sgt. Maj. Jose Rolando Rodriguez and command historian, Michael Clauss, discuss what Hispanic Heritage Month means to them and how Hispanic-American Soldiers have impacted the U.S. Army..
Resources
For Further Exploration
- U.S. Army Center of Military History: The Army and Diversity
- National Park Service - Fighting on Two Fronts: Latinos in the Military
- Center of Military History: Hispanic Americans in the U.S. Army
- The Library of Congress: National Hispanic Heritage Month
- The Library of Congress: Hispanic Reading Room
- Veterans Affairs: Hispanic Heritage
- Smithsonian Institute: Smithsonian Latino Center
- Arlington National Cemetery: Notable Hispanic Americans
- Library of Congress: Veterans History Project
- Center of Military History: 158th Infantry (Bushmasters)
- National Museum of the U.S. Army: The 65th Infantry Regiment
- Hispanic Americans in the Korean War - US Army Center of Military History
- Valor 24 Medal of Honor: Heroes of their generation and for a new generation
- Department of Defense - Congress Honors Puerto Rican Regiment for Heroic Korean War Service
- Library of Congress - American Minority Groups in the Vietnam War: A Resource Guide
Articles
- Department of Defense - Puerto Ricans Represented Throughout U.S. Military History
- 'From The Rough Riders To The 'Borinqueneers', Hispanic Americans Have Answered The Call To Serve'
- USO - 'Courage and Valor: 5 Stories of Hispanic American Military Heroes'
- Army.mil: Benavidez set standard for selfless sacrifice
- Army.mil: Hispanic Americans have served with distinction since nation's founding
- Army.mil: 3rd Infantry Division celebrates Hispanic Heritage Month
- Army.mil: From cattle ranch to general: The incredible journey of Richard E. Cavazos
- Army.mil: First female Sapper Leader Course instructor paves the way for others
- Army.mil: White Sands Missile Range recognizes Nine Hispanic women in Army History
Videos
- Paying it Forward | U.S. Army
- My Army Story - 1st Lt. Georgia Cervantes | U.S. Army
- Hispanic-American Soldiers Contributions to the U.S. Army | U.S. Army
- Hispanic American Veterans Share Their Experiences in Vietnam | Vietnam War 50th Commemoration
- American Patriots: Latinos in World War II
- 10 Hispanic American Military Heroes | Connecticut National Guard